More than an ERP or S&OP tool. UBC Analytics Manufacturing links sales forecasts, production plans, raw material requirements (MRP), manufacturing costs (BOM), and cash flow into one decision model.
You are not buying a module — you are buying control over factory economics
The market has ERP and WMS, but they record facts. UBC Analytics Manufacturing stands higher: it unifies demand planning and production capacities into a single IBP management logic.
Not just S&OP
A demand forecast disconnected from production is just numbers. What matters is how it loads lines and impacts raw material procurement.
Not just MRP
Knowing material needs is not enough. UBC Analytics shows how these inventories lock cash and impact the cash conversion cycle (CCC).
Not just Costing (BOM)
Costing without operational logic is disconnected from reality. UBC Analytics converts the shop floor plan into profit, margin, and Cash Flow.
MANUFACTURING IMPACT
What changes after implementation
According to industry benchmarks by McKinsey & Company and Oliver Wight, transitioning to Integrated Business Planning delivers proven financial results by optimizing the entire supply chain.
+15–20%
FG Fill Rate Improvement
Syncing sales and production plans minimizes FG shortages while maintaining optimal inventory levels.
Before: 82%After: 82%
−10–15%
Manufacturing Cost Reduction
Control of raw material, labor, and overhead variances through precise Bills of Materials (BOM).
Before: 100%After: 100%
−25–35%
WIP & Raw Materials Reduction
Automated MRP frees working capital by eliminating excessive raw material procurement.
Before: ₴25MAfter: ₴25.0M
CCC −18
days
Managed Cash Cycle
Forecasting raw material payments and FG inflows provides control over the plant's liquidity gap.
Before: 68 daysAfter: 68days
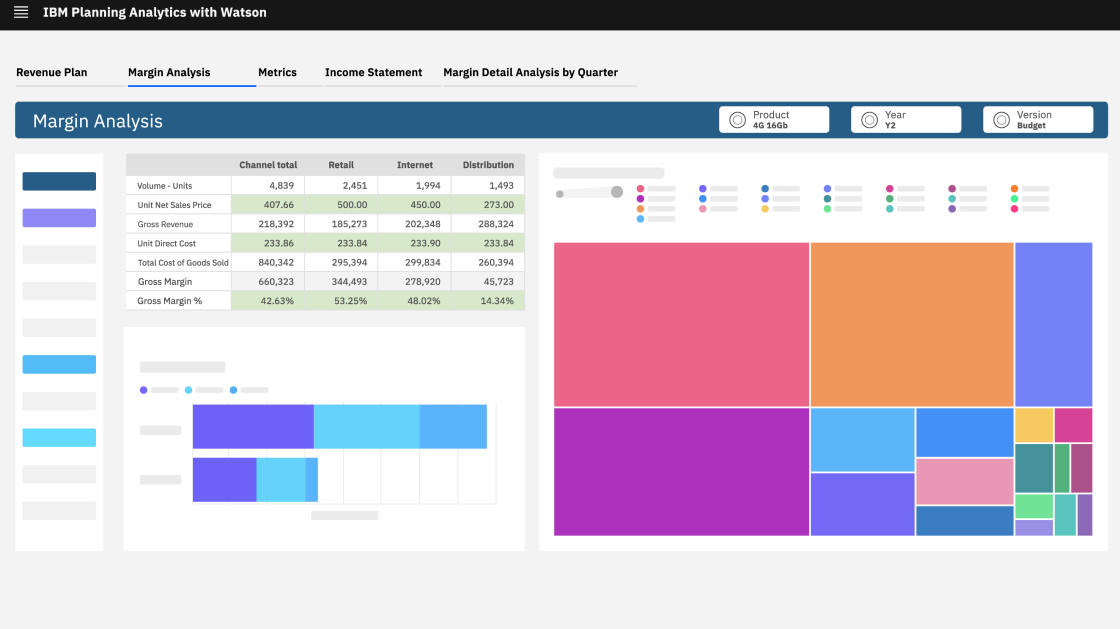
TRANSPARENT COSTING
Know the exact cost of every manufactured unit
No more waiting for month-end close. UBC Analytics Manufacturing provides managerial P&L and planned cost (COGM) in real-time, accounting for BOM, Direct Labor, and energy costs.
✓Multi-level Bills of Materials (BOM) for complex manufacturing
✓Planned and actual manufacturing cost calculation (COGM/COGS)
✓Analysis of consumption rate and raw material price variances
✓Allocation of manufacturing overheads by drivers
✓Scenario modeling of margins during tariff or supplier price changes
360°
visibility
manufacturing cycle
COGM TRACKER
+12.4%
Yield efficiency
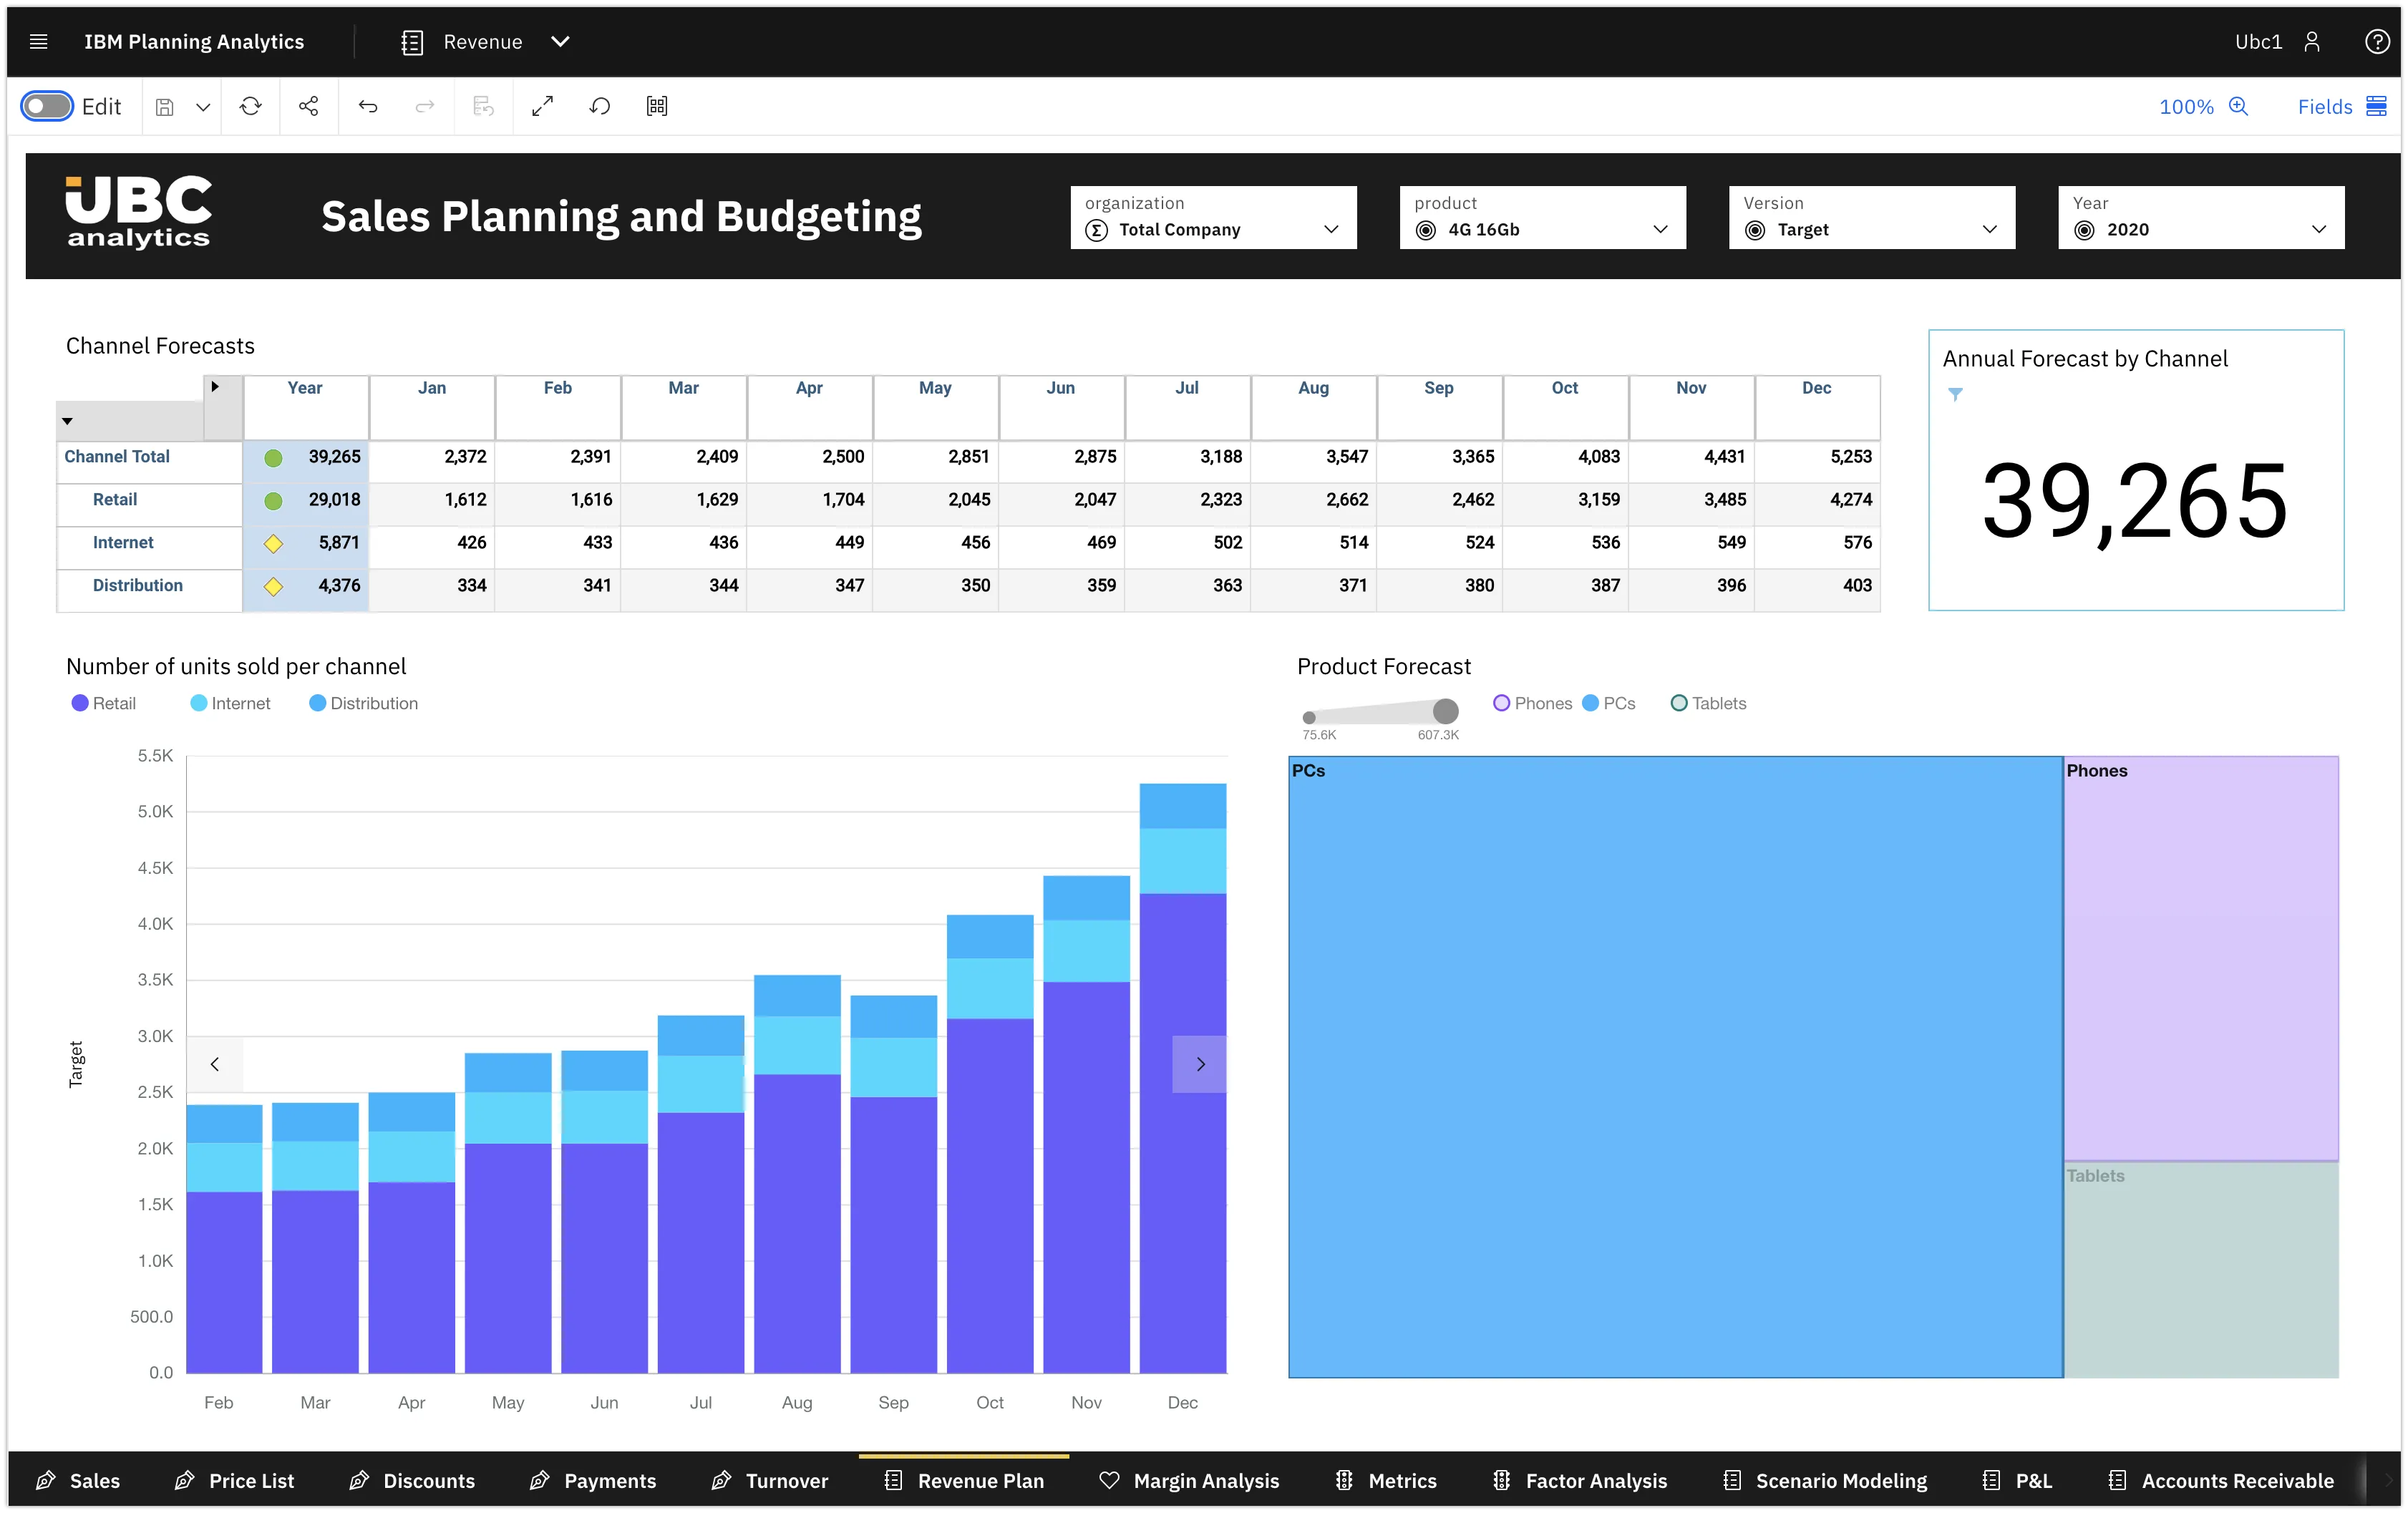
ONE IBP FLOW — FROM DEMAND TO CASH
Not a set of sheets — one Integrated Planning logic
A true closed-loop Integrated Planning system: demand forecasts automatically drive the Master Production Schedule (MPS), triggering material requirements (MRP) through multi-level BOMs, while simultaneously calculating manufacturing costs and Cash Flow projections.
Dashboards for SCM, manufacturing, finance, and CEO — all on one Integrated Planning data model.
UBC Analytics Manufacturing Management Contours
9 functional IBP model blocks: from strategic demand forecasting to operational factory Cash Flow.
S&OP: Integrated Sales & Operations Planning
Synchronizing commercial goals with actual manufacturing capacities.
CONTOUR OBJECTIVE
Consolidating sales, marketing, and production plans into a single aligned consensus forecast. Calculating forecast accuracy (MAPE) and modeling "what-if" market scenarios.
BUSINESS VALUE
S&OP prevents product shortages during peak periods and eliminates overproduction risks. Management gains a highly reliable data source to proactively assess the financial impact of market changes.
Консенсус-прогнозMAPE & BiasWhat-If Аналіз
MPS: Master Production Schedule
Transforming aggregate demand into an optimized line loading schedule.
CONTOUR OBJECTIVE
Optimal allocation of production orders across lines considering available capacities (RCCP). Balancing equipment loads to minimize constant changeover times.
BUSINESS VALUE
MPS ensures the highest order fulfillment rate (Fill Rate) without creating excess finished goods inventory. Continuous OEE monitoring helps identify plant bottlenecks long before they become critical.
Оптимізація OEEУправління НЗППереналагодження
MRP: Material Requirements Planning
Uninterrupted production supply without creating excess warehouse inventory.
CONTOUR OBJECTIVE
Automatic BOM explosion of the production plan to determine exact raw material requirements. Generating clear procurement schedules factoring in supplier Lead Times and safety stocks.
BUSINESS VALUE
The system completely eliminates factory shutdowns and downtime due to sudden component shortages. Simultaneously, substantial working capital is freed up by avoiding the "freezing" of cash in excessive raw materials.
Розвузлування BOMLead TimeСтраховий запас
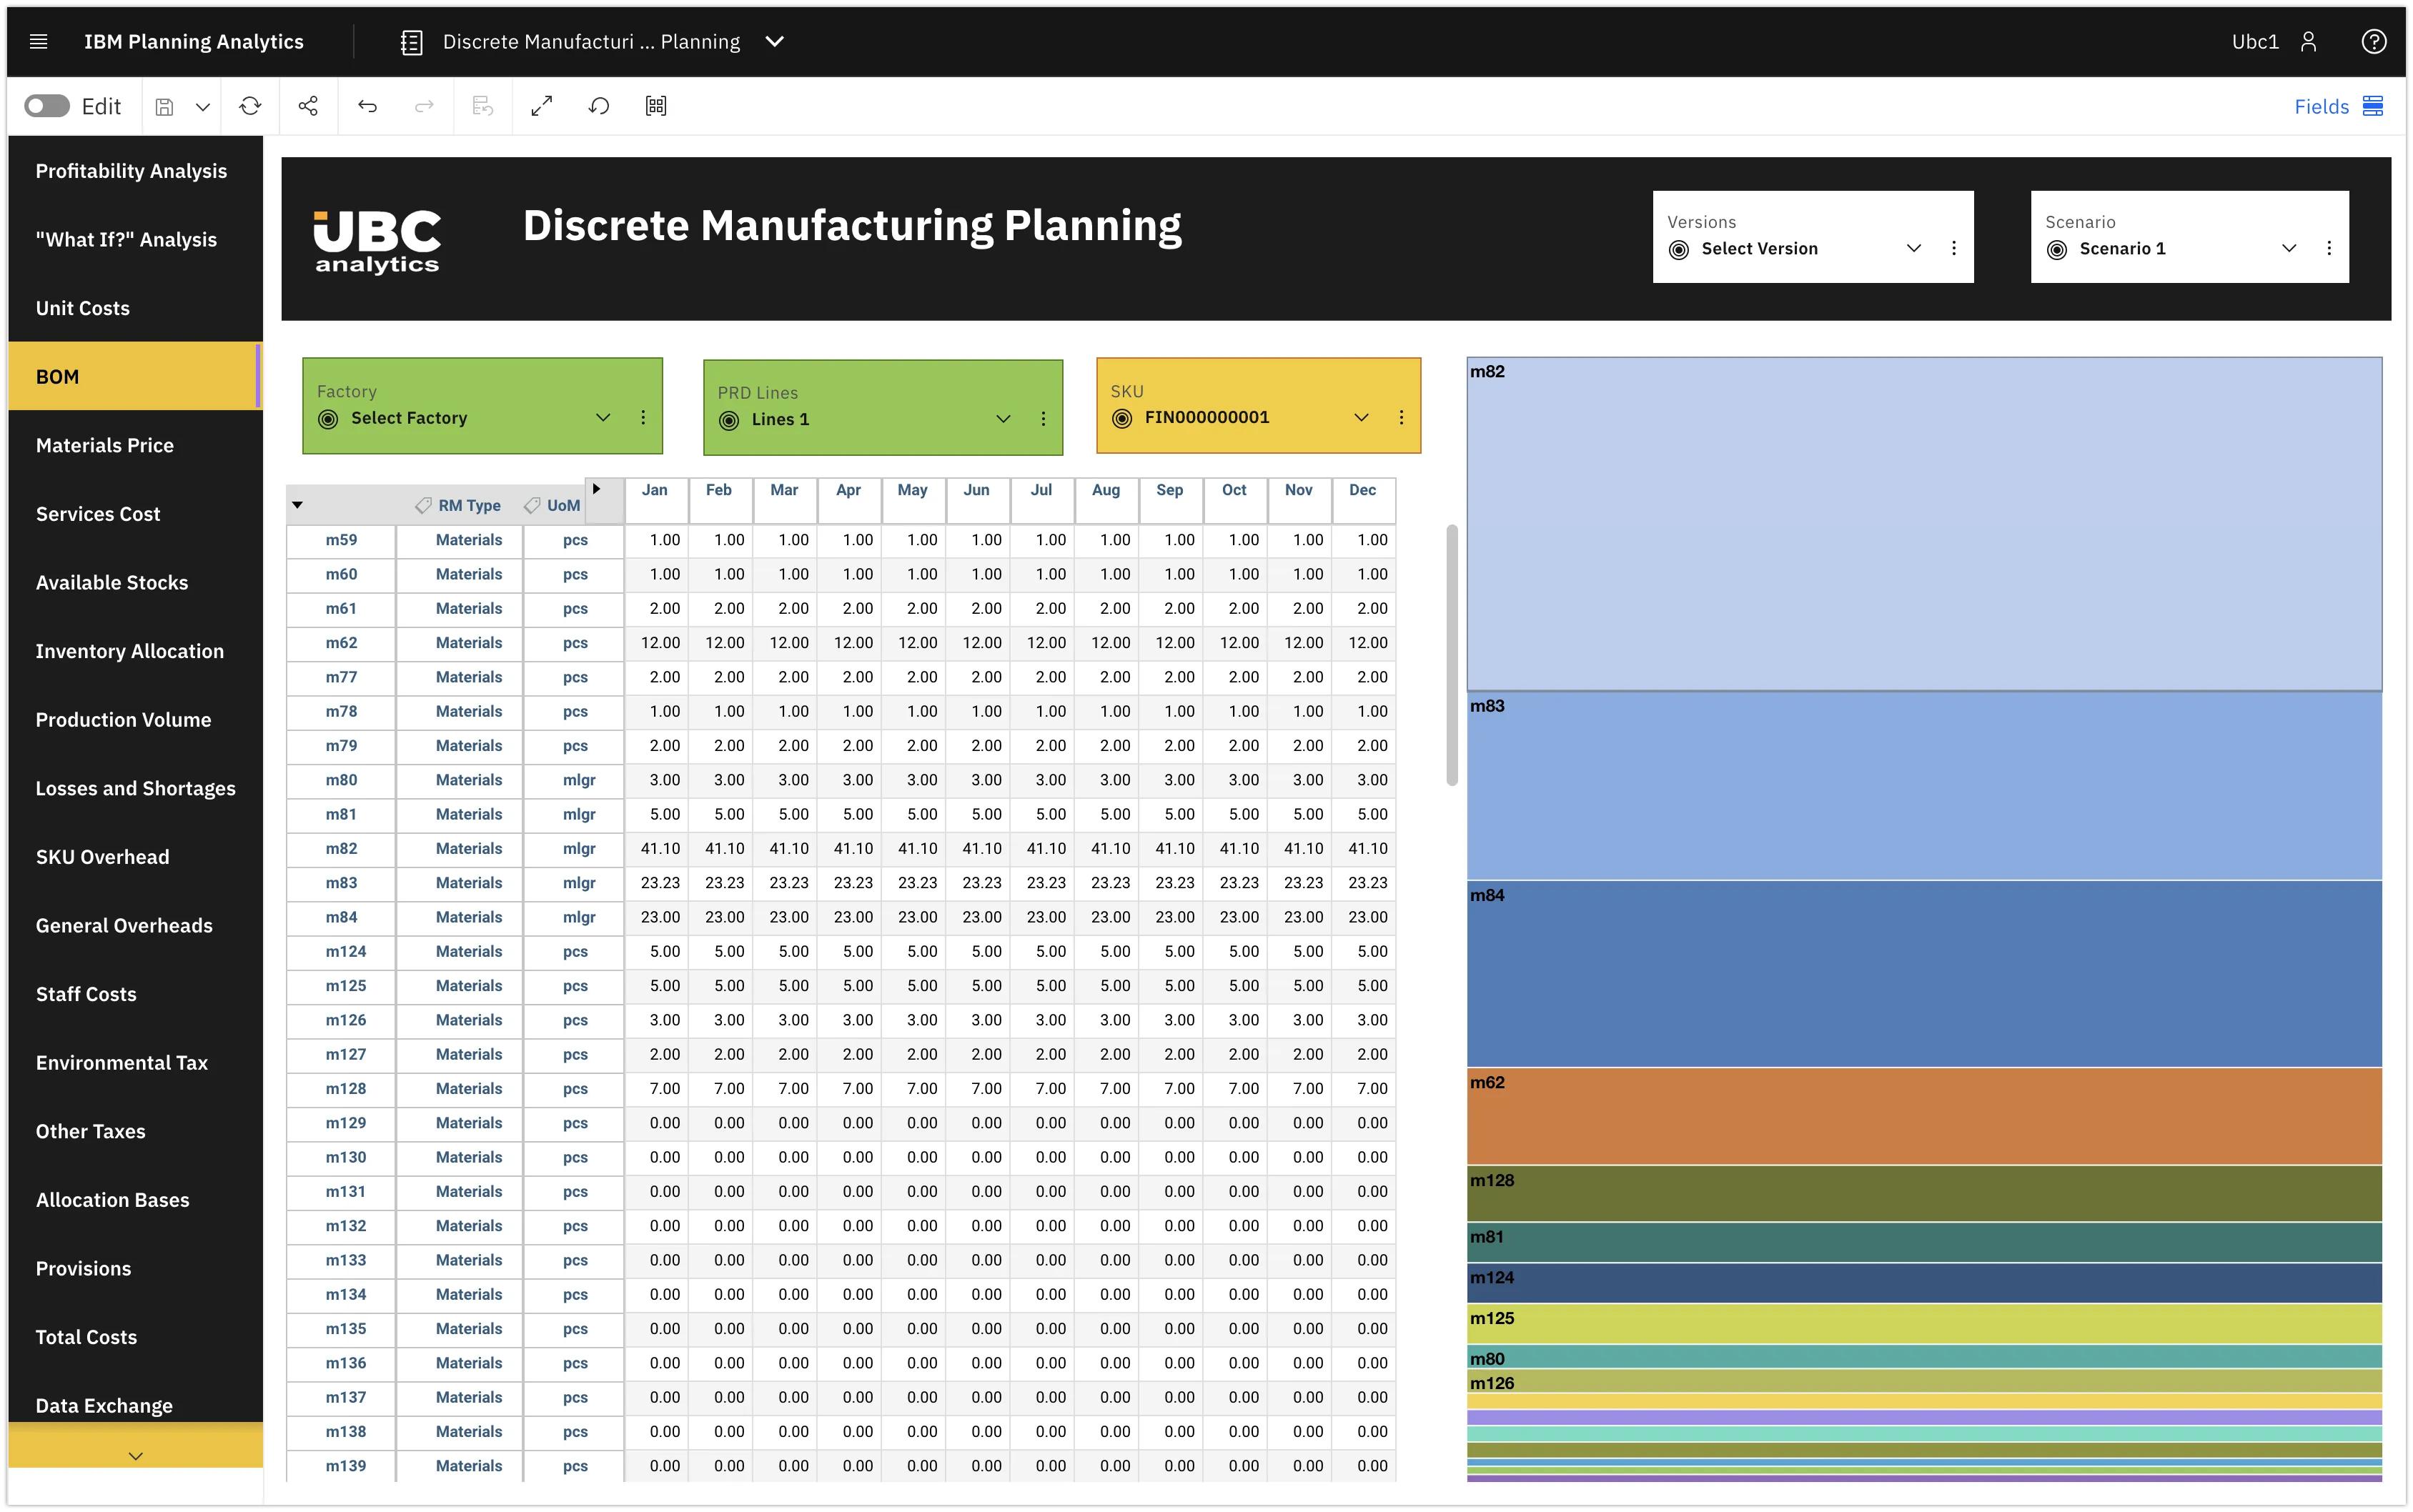
BOM & Manufacturing Costing (COGM)
Deep control and variance analysis of every cost item in manufacturing.
CONTOUR OBJECTIVE
Instant recalculation of planned (Standard Cost) and actual costs based on up-to-date BOMs and routings. Fair allocation of overheads and comprehensive variance analysis across all items.
BUSINESS VALUE
The tool clearly separates financial losses from purchase price spikes versus losses due to inefficient raw material usage on the lines. This guarantees maximum cost transparency and reliably protects the target margin of every manufactured unit.
Аналіз відхиленьПланова собівартістьАлокація витрат
Sales & Commercial Margin
Transitioning from gross revenue control to net profitability management.
CONTOUR OBJECTIVE
Building a Pricing Waterfall for every transaction. Tracking all commercial conditions: direct discounts, distributor retro-bonuses, and marketing investments.
BUSINESS VALUE
Management gains crystal-clear visibility into Net Sales and true Contribution Margin (CM) for each client and SKU. This analytics empowers confident portfolio optimization, effortlessly cutting off economically unprofitable sales channels.
Каскад ціноутворенняЧиста виручкаМаржа покриття
Logistics & Cost-to-Serve
Precise calculation of order fulfillment costs and supply chain control.
CONTOUR OBJECTIVE
Aggregating transportation, warehousing, and customs processing costs to calculate the comprehensive Cost-to-Serve metric. Continuous monitoring of service quality and the OTIF delivery metric.
BUSINESS VALUE
Modeling optimal transport loading radically reduces the per-unit delivery expense. This careful balance between costs and logistics service quality helps evaluate the true feasibility of expanding into new geographical regions.
Cost-to-ServeПоказник OTIFОптимізація фрахту
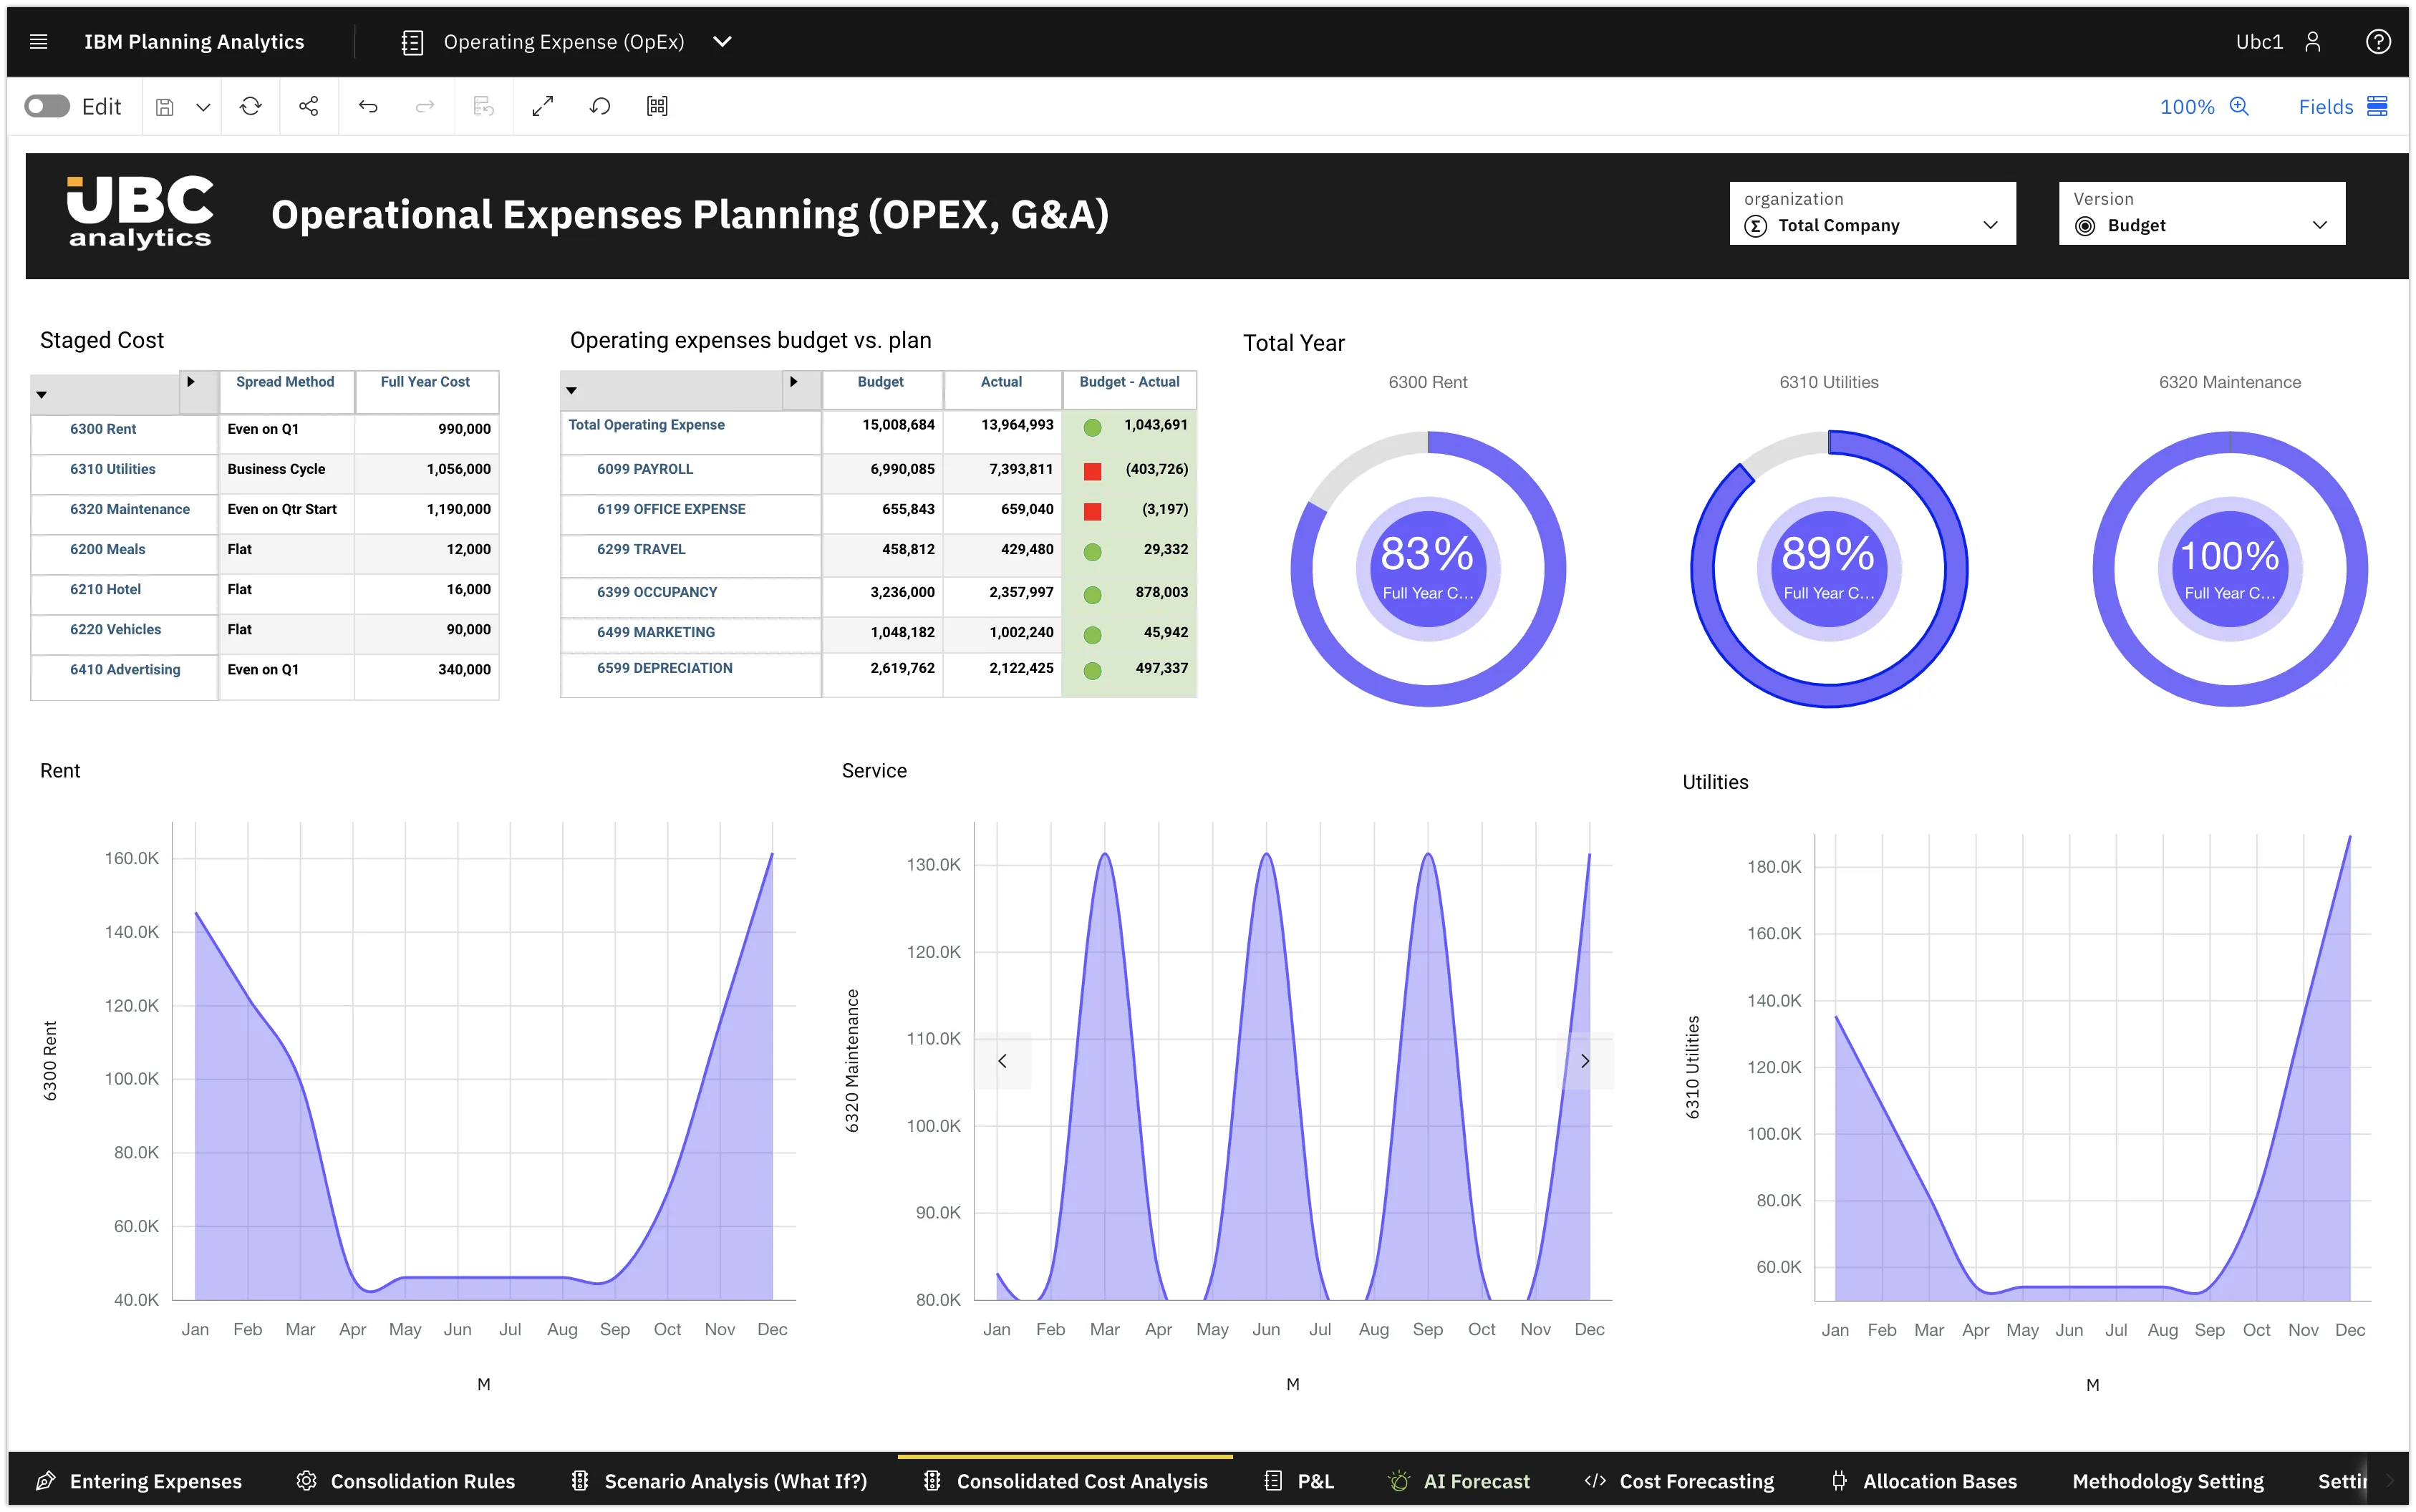
OPEX Budgets & CAPEX Investments
Strategic management of overhead expenses and capital expenditures.
CONTOUR OBJECTIVE
Strict plan-vs-actual control of fixed overhead costs (OPEX) across every department. Detailed modeling of investment budgets (CAPEX) for equipment purchases or modernizations.
BUSINESS VALUE
Platform algorithms automatically calculate the exact impact of any investments on future product costs. This systematically minimizes financial risks, guaranteeing the expected Payback Period and strong ROI for shareholders.
Контроль OPEXОкупність CAPEXАналіз ROI
Management P&L & Operating Margin
Consolidation of operational data into the final factory profitability report.
CONTOUR OBJECTIVE
Consolidating all manufacturing, logistics, and commercial metrics into a unified Profit & Loss management report. Utilizing Full Allocation of costs to determine the exact profitability of individual brands.
BUSINESS VALUE
The report generates a completely objective EBITDA figure, showcasing the overall health of the business. Thanks to scenario modeling, the Board of Directors can proactively assess the impact of macroeconomic shocks on the company's annual profit.
Управлінський P&LEBITDAПовний розподіл
Cash Flow & Working Capital
Liquidity forecasting and management of cash conversion speed.
CONTOUR OBJECTIVE
Reliable liquidity forecasting based on production plans and contractual terms with clients. Continuous calculation of the Cash Conversion Cycle (CCC) metric to manage working capital efficiency.
BUSINESS VALUE
A dynamic payment calendar automatically and proactively identifies upcoming cash gaps for the factory. Balanced management of the financial cycle frees up internal capital and significantly reduces the business's dependence on expensive bank loans.
Фінансовий цикл (CCC)Прогноз ліквідностіОборотний капітал
TECHNOLOGICAL CORE
Built on the power of IBM Planning Analytics
UBC Analytics Manufacturing uses the IBM TM1 enterprise engine for instant recalculation of complex production models and BOMs.
In-Memory OLAP
Changing the formulation (BOM) instantly recalculates the cost and P&L of the entire company.
AI Forecasting
Using IBM algorithms for accurate demand and yield forecasting.
Excel Integration
Familiar interface for finance professionals backed by an Enterprise-level database.
Enterprise Security
Data security and access levels according to corporate standards.
Manufacturing leaders trust IBM Planning Analytics
MANUFACTURING MANAGEMENT LEVELS
The system works at every level
The CEO sees the development strategy, the Production Director sees asset efficiency (OEE), the planning department sees line utilization, and the shop floor manager sees shift schedules.
PLANNING PYRAMID (IBP)
Strategic
12-18 mo
Tactical
1-3 months
Operational
1-4 weeks
Strategic
HORIZON: 12-18 MONTHS
CEO, CFO, PRODUCTION DIRECTOR
S&OP scenarios and capacity balance
Investment planning (CAPEX)
New product launch strategy
Modernization ROI analysis
+15%
ROI
Tactical
HORIZON: 1-3 MONTHS
SUPPLY CHAIN, FP&A, PLANNING DEPT
Master Production Schedule (MPS)
Material Requirements (MRP)
Batch and inventory management
Manufacturing cost control
88.5%
OEE
Operational
HORIZON: 1-4 WEEKS
SHOP MASTERS, PROCUREMENT, TREASURY
Daily shift tasks for lines
Warehouse stock control
Operational payment calendar
Variance dispatching
98%
Plan Hit
Integration with your ecosystem
UBC Analytics Manufacturing consolidates data from ERP (SAP, 1C), MES, WMS, and Excel into a single Integrated Planning model.
ERP
MES
WMS
CRM
TMS
1C
SAP
EXCEL
ABOUT COMPANY
We implement Integrated Business Planning for manufacturing
UBC Analytics helps factories shift from "firefighting" to proactive management by synchronizing demand and production.
IBM
Expertise
Deep practice in implementing IBM Planning Analytics in manufacturing.
> 100
Projects
Delivered IBP cases for large manufacturing holdings.
> 18
Years
Experience in building MRP, BOM, and P&L models.
> 30
Countries
International project delivery experience.
Expert analysis of your manufacturing
Get a free audit of S&OP and MRP processes. We will show you how IBM Planning Analytics solves your challenges.
Thank you! We will contact you soon.
S&OP & DIGITAL TWIN
Request a demo based on your production scenario
We will show how to connect production planning, raw material procurement, S&OP, costing, and cash flow in one IBP model for your company.
✓Free demo using a manufacturing enterprise use case
✓Analysis of money leakage: locked raw materials, line downtime, inaccurate BOM
✓IBP implementation roadmap
✓"What-if" scenario modeling for capacity planning